Most of the reporting month is assembly, not analysis.

RankLens connects to Search Console and GA4, builds the comparison, ranks what moved, writes the summary, and keeps your Sheets and Looker Studio reports refreshed on their own. What is left over is the part that needed you.

  • Read-only access
  • No analytics data stored
  • Disconnect in one click
One connection, four surfaces Built live from Google's APIs, read-only
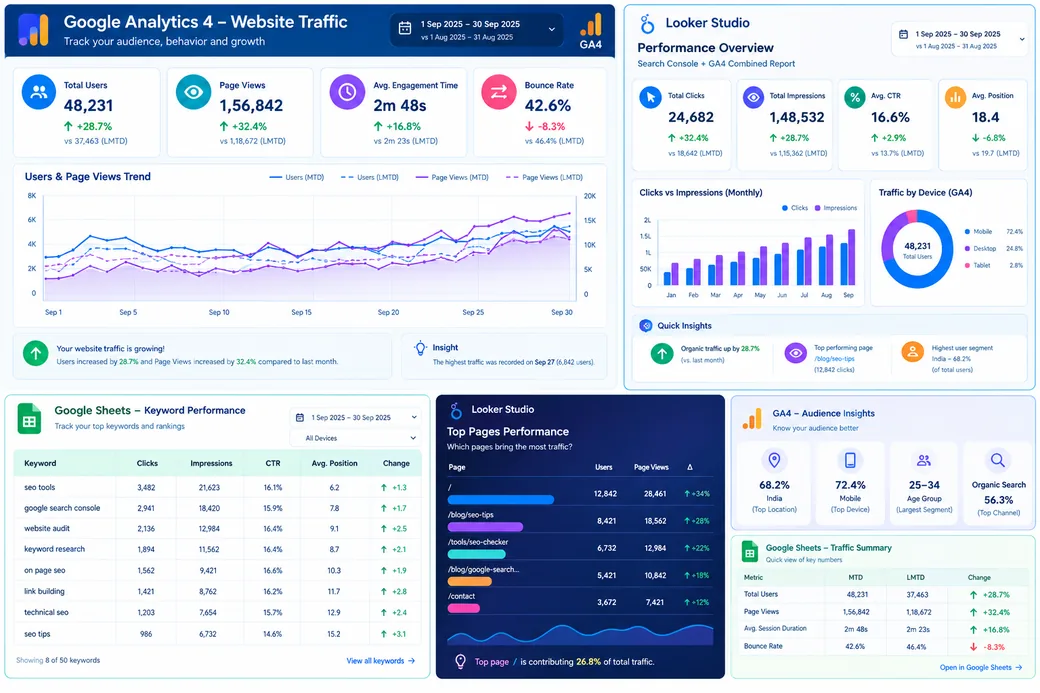
A combined reporting view showing Google Analytics 4 traffic metrics, two Looker Studio dashboards and a Google Sheets keyword performance table side by side.
  • Search ConsoleWhat moved, and the pages behind it
  • Analytics 4Sessions and events on the same window
  • Google SheetsTabs refreshed on a schedule
  • Looker StudioDashboards that survive handover

Every figure is pulled straight from Google, never from a copy we made earlier.

Four reporting surfaces, one team behind them

Most SEO teams already work across all four. The problem is that each one is maintained separately, by hand, by whoever has time. We automate them together so the numbers agree and the work stops repeating.

Search Console reporting

Clicks, impressions, CTR and position pulled through the API for any window you ask for, with the comparison period computed rather than exported twice and joined by hand. Every movement is traced back to the pages and queries that caused it.

  • Movers ranked by clicks gained and lost, both directions
  • CTR gaps surfaced where impressions are high and clicks are not
  • Position bands kept intact instead of averaged into one number
  • Brand and non-brand split properly, not by a fragile regex
Google Analytics 4 reporting

Sessions, users, engaged sessions and key events on exactly the window your Search Console report uses, so the two documents can sit next to each other without anyone having to explain the gap between them.

  • Channels and landing pages that moved, with the size of the move
  • Key events tracked against the same comparison period
  • GA4 and Search Console kept honestly separate, never blended
  • Every table exports to CSV in one click

Google Sheets automation

Sheets is where most clients are comfortable, so we make it work properly. Raw tabs written by automation, working tabs that hold the formulas, and a report tab anyone can reformat without breaking the numbers underneath.

  • Scheduled pulls that refresh without anyone opening the file
  • Every refresh stamped with the time it ran, so stale tabs say so
  • Several properties rolled into a single view
  • Built without the Apps Script sprawl that nobody can maintain later

Looker Studio dashboards

Dashboards built around one recurring question rather than every metric that happens to be available, with the comparison period wired in and the data sources named so the next person can maintain it.

  • Comparison built into each chart, not bolted on afterwards
  • Blended sources avoided where they would quietly distort the totals
  • Handover documentation written with the build
  • Alerts when clicks or sessions cross a threshold you set

What comes out at the end

Three of the layouts at the size you would actually read them, rather than a thumbnail you have to take on trust.

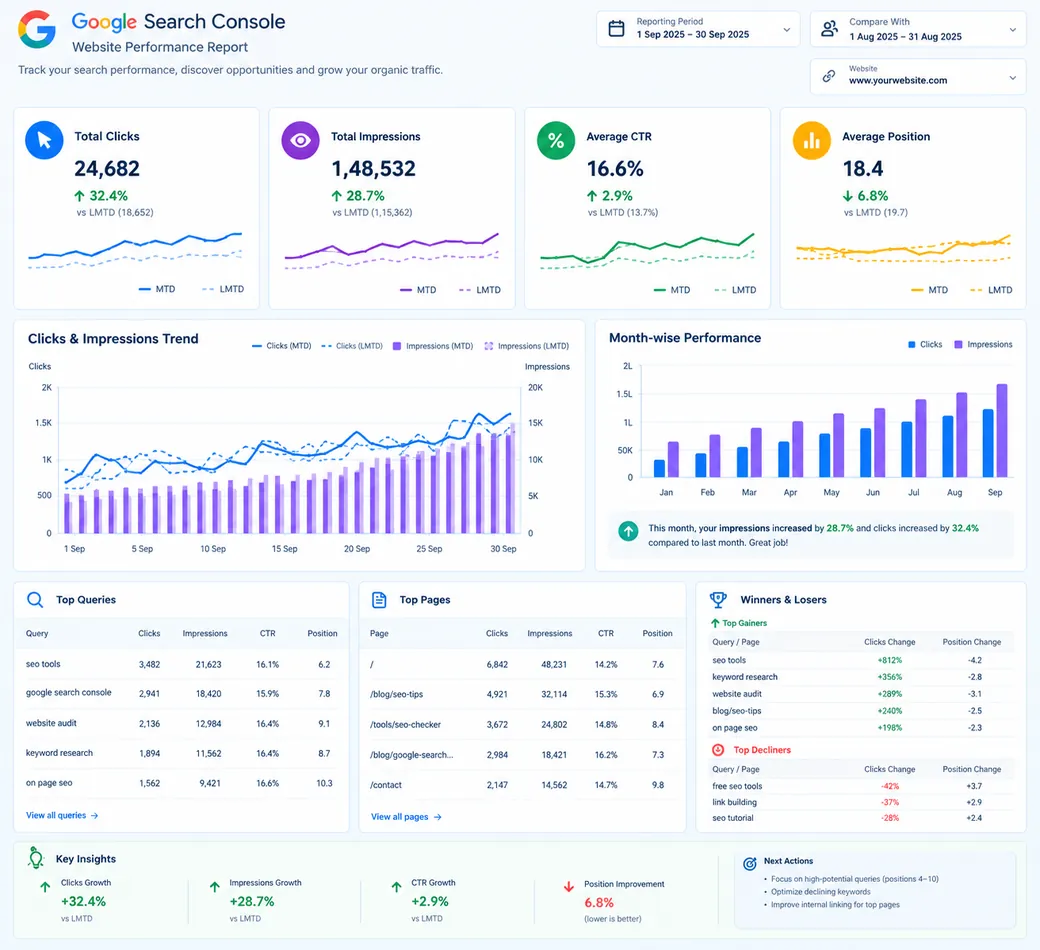
Search Console performance report showing clicks, impressions, CTR and average position against the previous period, with trend charts, top queries, top pages, and a table of gainers and decliners.

Search Console performance

The four headline metrics with their comparison period attached, the daily trend for both windows, and every movement traced back to the queries and pages that caused it. Gainers and decliners are ranked, so the commentary is already half written by the time you open it.

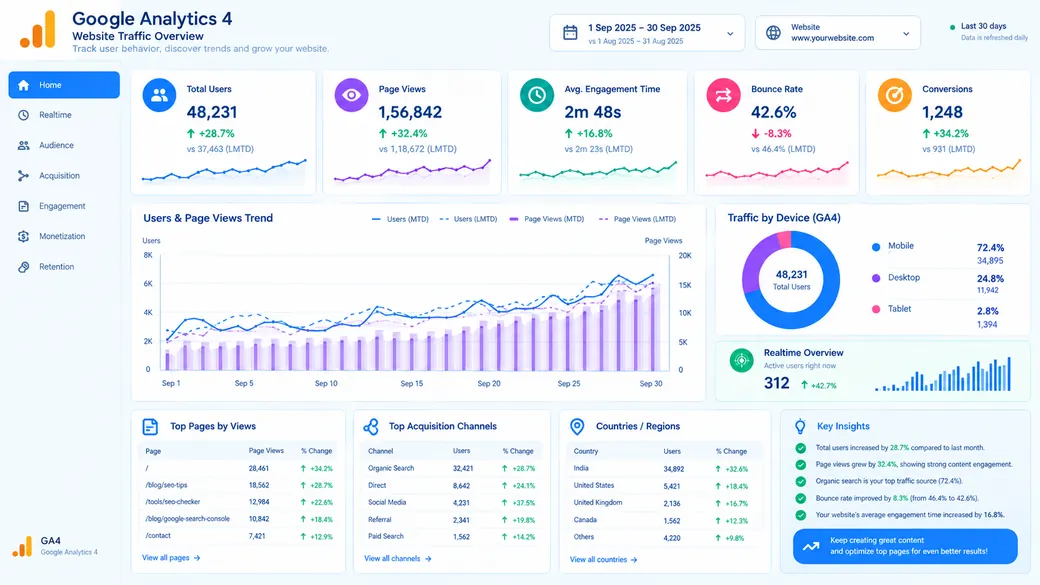
Google Analytics 4 traffic overview with total users, page views, engagement time, bounce rate and conversions, a users and page views trend chart, device split, top pages, acquisition channels and countries.

Analytics 4 overview

Sessions, users, engagement and key events on exactly the window the Search Console report uses, broken down by channel, landing page, device and region, so the two documents can sit next to each other without anyone explaining the gap.

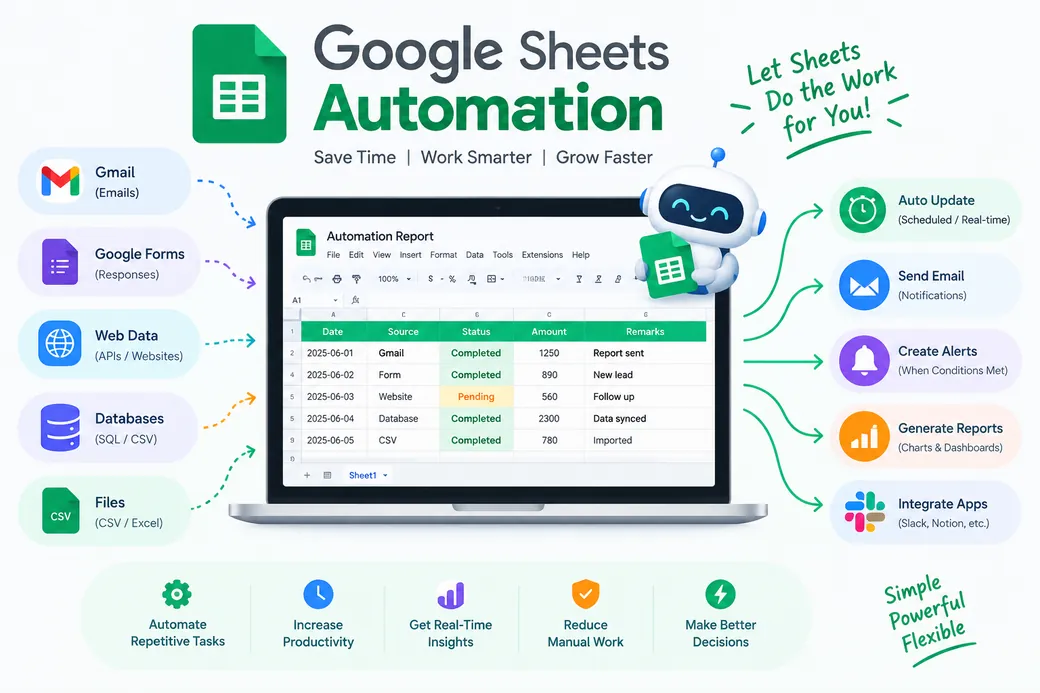
Diagram of a Google Sheets automation: inputs from Gmail, Google Forms, web APIs, databases and CSV files feeding a sheet, which then auto updates, sends email, raises alerts, generates reports and pushes data to other apps.

Sheets automation

What feeds the sheet, what the sheet does with it, and what it sends onward once the numbers land. Scheduled refreshes, threshold alerts and hand-offs into the tools your team already has open.

Where the reporting month actually goes

Ask an SEO manager what takes longest and the answer is rarely “working out what happened”. It is everything that has to happen first. Here is one property, one monthly cycle, measured.

Task By hand With RankLens Saved
Pulling the exports This month, last month, pages, queries, GA4. Six downloads before a sentence gets written. 4h 10m 0h 00m −4h 10m
Joining this month to last Matching rows, fixing the date window, rebuilding the pivot when a column order changes. 2h 30m 0h 00m −2h 30m
Rebuilding the deck, sheet or dashboard Same layout, twelfth time, because the numbers changed and the formatting broke. 4h 00m 0h 20m −3h 40m
Writing the commentary Computing the change mentally, finding the pages behind it, then phrasing all of that. 2h 45m 0h 15m −2h 30m
Deciding what to do next The job you were hired for. We do not touch this one. 2h 00m 2h 00m no change
Per property, per month 15h 25m 2h 35m −12h 50m

Timings from a mid-sized agency team running a monthly Search Console and GA4 cycle on a single property. Your mileage moves with the number of pages you report on.

The hours are only the obvious part

Automating the assembly work changes what the reporting is capable of telling you.

You answer in the meeting, not the day after

Someone asks why traffic dipped in week two. Today that becomes a task and a reply tomorrow. With the report built from live data, the answer arrives inside the same conversation — and mid-month checks stop being a favour you have to ask for.

The cheap SEO wins stop hiding

Pages carrying impressions but not clicks, queries parked between position four and ten, titles that stopped matching intent. Ranked by opportunity rather than volume, they are the fastest gains available and they are invisible in an export.

The report reads the same in month eight

Same window, same definitions, same order of tables, whoever is on shift. Nothing quietly changes underneath the numbers, so month-to-month figures stay comparable and the client opens a document they already know how to read.

Four steps, and only the first needs setting up

Roughly two minutes from signing up to a finished report.

Connect

Sign in with Google and grant read-only access to Search Console and GA4. We ask for nothing we do not read.

Pick a property

Every verified property on your account shows up in the console. Choose the one you are reporting on.

Run a template

Select the report you need. It is built from live data at the moment you press run, comparison included.

Send it

Read the summary, export the tables, or let it write straight into your sheet or dashboard.

The template shelf

Open any template to see the tables it produces, the metrics it carries and a sample of the finished report before you commit to it.

Or send us the report shape you already use

Scheduled pulls, several properties rolled into one view, alerts on a threshold, a layout your client has read for three years and does not want changed. We build it, document it and hand it over.

Get a quote

We do not keep a copy of your data

Every report is built the moment you press run, from the API, using your own access. Close the page and there is nothing left behind except the token that let us ask.

That is a constraint we chose, not a feature we have not got to. Stored analytics data is a liability for you and for us, and a report built from a cache is a report that can go stale without saying so.

  • Nothing written to our database. No clicks, impressions, queries, sessions or page-level data.
  • Read-only scopes only. We cannot change anything inside your property, by design.
  • Revoked on disconnect. One click in the console and the token is withdrawn with Google immediately.
  • Never shared across accounts. Reports are generated per session and belong to that session.

Notes on getting reporting right

The API quirks, the comparisons that mislead, and the dashboards that survive past month two.

Read everything on the blog

Questions worth asking before you connect

The ones people actually send us, answered without the sales voice.

Is my Search Console and GA4 data stored anywhere?

No. Reports are assembled in memory when you press run and discarded when the session ends. The only thing we keep is the OAuth token that lets us make the request on your behalf, and revoking it takes one click.

What access does RankLens need?

Read-only scopes for Search Console and GA4, plus your email address so the account exists. We cannot submit sitemaps, request indexing, edit settings or change anything else inside your property, because the scopes do not permit it. Sheets automation asks separately for access to the specific file it writes to.

Does this replace Looker Studio?

Only if you want it to. Most teams keep Looker Studio for the always-on dashboard and use RankLens for the monthly narrative report, which is the part Looker is worst at. We also build the Looker templates themselves, with the comparison period wired in properly, so the two work together rather than competing.

How is this different from just exporting from Search Console?

The interface caps rows and hands you one period at a time with no comparison, so you export twice and join by hand. The API returns any window you ask for at the dimension you ask for. We use the API, compute the difference, rank the pages and queries behind it, and write the summary from that.

What do the paid templates include?

A one-off purchase gets you the template file itself, wired to your own data sources, plus the setup notes and a handover document so someone other than you can maintain it. Updates to that template are included. There is no subscription attached to a template purchase.

How many properties can I connect?

Every verified property on the Google account you sign in with appears in the console. Connect one or connect forty; running a report on one does not affect the others.

Take the reporting week back.

Connect a property, run a template, and see whether the report reads the way you would have written it. If it does not, you have lost two minutes.

Free to start

Every console template, on as many verified properties as you have, with no card and no trial clock running in the corner.

Create your account

Takes about two minutes. Read-only, and reversible.